Antennas: Measurements & Experiences

This page shows measurements on BOG and EWE done with a Vector Network Analyzer. The left chart shows the S11 magnitude, i.e. the reflection back to the input when the antenna is used in transmission mode. The lower the curve the better. A resistor would reflect nothing and the red curve would be at the bottom.
The Smith chart
on the left shows the impedances for that frequency range. The center is 50 Ohms, and increases toward the right, decreases toward the left. Toward the top/bottom it becomes capacitive / inductive. The ideal match is thus a dot in the center (= 50 Ohm, no inductive/capacitive).
The charts show the 200...2000 kHz range, the markers (small triangles) are set to 600, 1000, 1500 kHz
The PDF-files hold the full resolution charts
The ground was soaking wet marshland (good conductivity)

Comparing antennas is not easy as I found out. One lesson I learned is, to use one setup for several days and then draw your conclusions. Don't do it after just one day. It happened that while initially results looked nicely, suddenly it got worse for no apparent reason for a few days. This seemed to be caused by the changing ionospheric condition, you always have to factor that in.

Beverage 300m pointing 320° (BOG = Beverage over ground)  

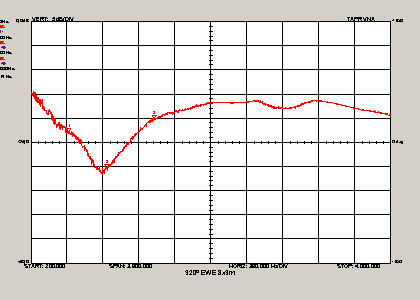
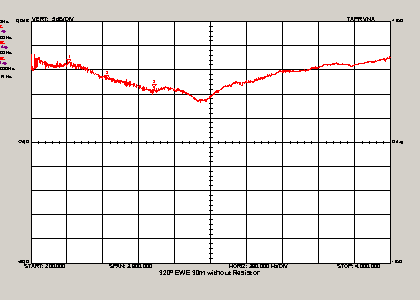
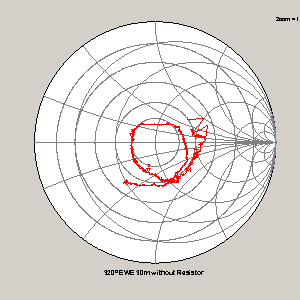
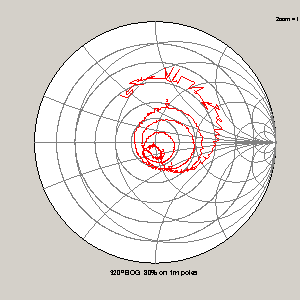
on Ground (full resolution PDF)

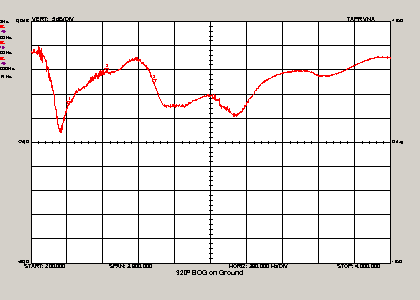
Initially I put the entire wire directly on ground to avoid strolling deer ripping it apart. But I then found that TA levels were not really great. So I raised the wire on 1m poles for 80% of the lenght and left the remaining 20% section on ground where animals would most likely stroll. That increased levels substantially and I used that setup from then on. For a test I lifted the entire lenght on 1m poles but the difference was not really big. The chart above shows that reflection is much greater than when lifted 1m above ground

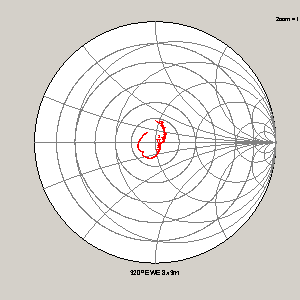
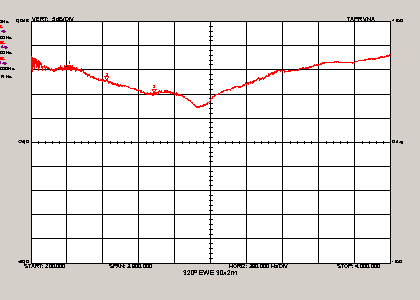
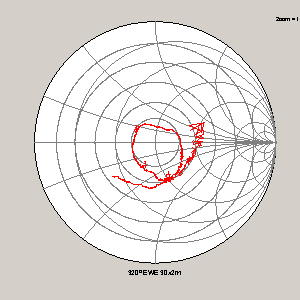
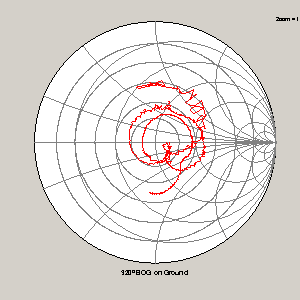
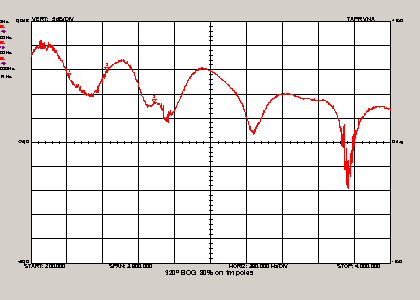
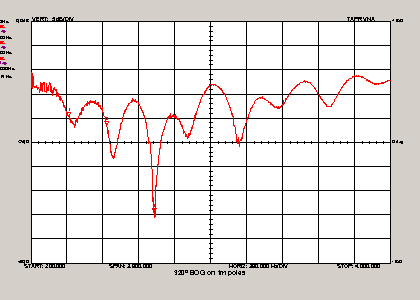
20% on ground, 80% on 1m poles (full resolution PDF
)


100% on 1m poles (full resolution PDF
)

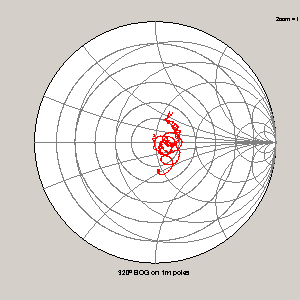
When entirely lifted 1m above ground the impedance match improves a lot, the 0,2-2Mhz range stays pretty close to 50 Ohms. Also the lower LW improves, but that did not help much, since LW signals were already very strong.

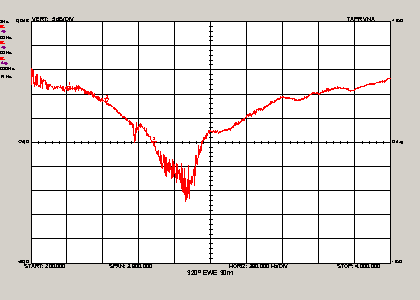
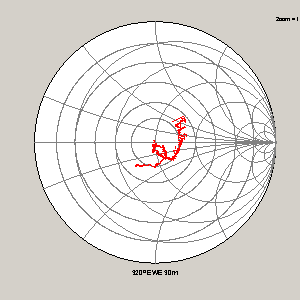
20% on ground 80% on 1m poles 0,2 - 30Mhz (full resolution PDF
)

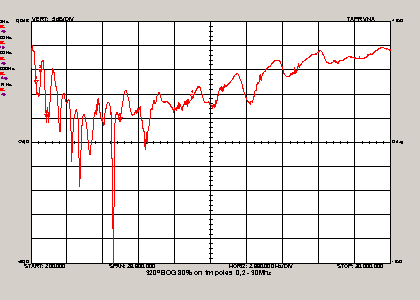
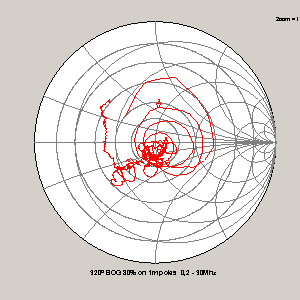
This was just done to see how it looks above 2 MHz, but reflection and mismatch increases. That was also proved reception wise. On higher SW frequencies the BOG performed less and less. My EWE outperformed the BOG easily in this range.

EWE  

EWE 8x3m (full resolution PDF)

I started with an 8x3m EWE described here for tropical band usage. It was set up 4m away side by side with the BOG-320° at its feedpoint and looked in the same direction in order to compare both. To prove that both don't interact with each other, I briefly dismantled the BOG but found no difference on the EWE.
On 1660 kHz it produced levels that are similar to the BOG but levels decreased towards the lower frequencies. 610 kHz was already 10dB lower, 198 kHz was 20dB lower. Greenland on 650 was always a lot weaker on the EWE, unacceptable for me. So I extended it to a 30x4m EWE (what the tree arrangement had to offer). That increased LW signals substantially. Compared to the BOG 198 kHz is now only 10dB lower, Greenland 650 came in at equal levels
Adjusting the EWE termination resistor (560...900 Ohm) for optimum F/B ratio can only be achieved for one frequency segment. On 540 kHz arrives Hungary from behind and from the side arrives Belgium. Adjusting allowed me either to suppress one of them quite well, but not both of them simultaneously. 900 Milano and 918 Slovenia and 1134 Croatia can be well reduced, but with a different resistor value, so I chose the 900-1100 range. This definitely suggests using a remote controlled resistor to maximize F/B ratio on the fly for the currently used frequency. The EWE had a much better F/B than the BOG. I also tried to adjust its resistor, but the improvement was just a little. It never got close to the EWE. But despite this the BOG always pulled in TA signals better, one reason is its smaller front lobe. The wider EWE front lobe picked up some UK Tx were the BOG reduced them resulting in clearer TA signals. But on the X-band without local unwanted signals the difference was marginal. Only in late morning when TA Tx fade, the BOG pulls them in a little longer. In a few cases the EWE performed better due to its better F/B ratio.

EWE 30x4m (full resolution PDF
)


EWE 30x4m without termination resistor (full resolution PDF
)

I just wanted to know how an unterminated EWE looked like. Reflection and mismatch increased.

EWE 30x2m (full resolution PDF
)

Because the 30x4m EWE worked much better I also tried a 30x2m EWE. Front/back ratio increased quite a bit up to around 1400kHz, above that no improvements was observed. First it looked very promising for TA signals. But in reality it picked up TA signals a lot weaker. The better F/B ratio was no advantage, probably only useful when DXing European stations. It seems not to pick up well signals arriving at a low angle. So I raised it up to 4m again.

Spectrum at 18:51 UTC of alternating BOG and EWE 30x4m both pointing to 320°
This shows that the EWE drops off toward the lower frequencies starting at mid-MW

If you don't see it animated then turn on GIF-animation in your browser setting


  ©  3S design GmbH   Zeiterfassungs-Systeme   Zugangskontrolle-Systeme   BDE-Systeme   Ferienwohnung südliche Nordsee